DRISHTI · CHAPTER 3.3
A Forest Became a Curve
Measure the same square again and again and it stops being a place. It becomes a line that rises, falls and remembers what happened to it last year.
EARTHVISION LAB · ~7 MIN READ
TIME
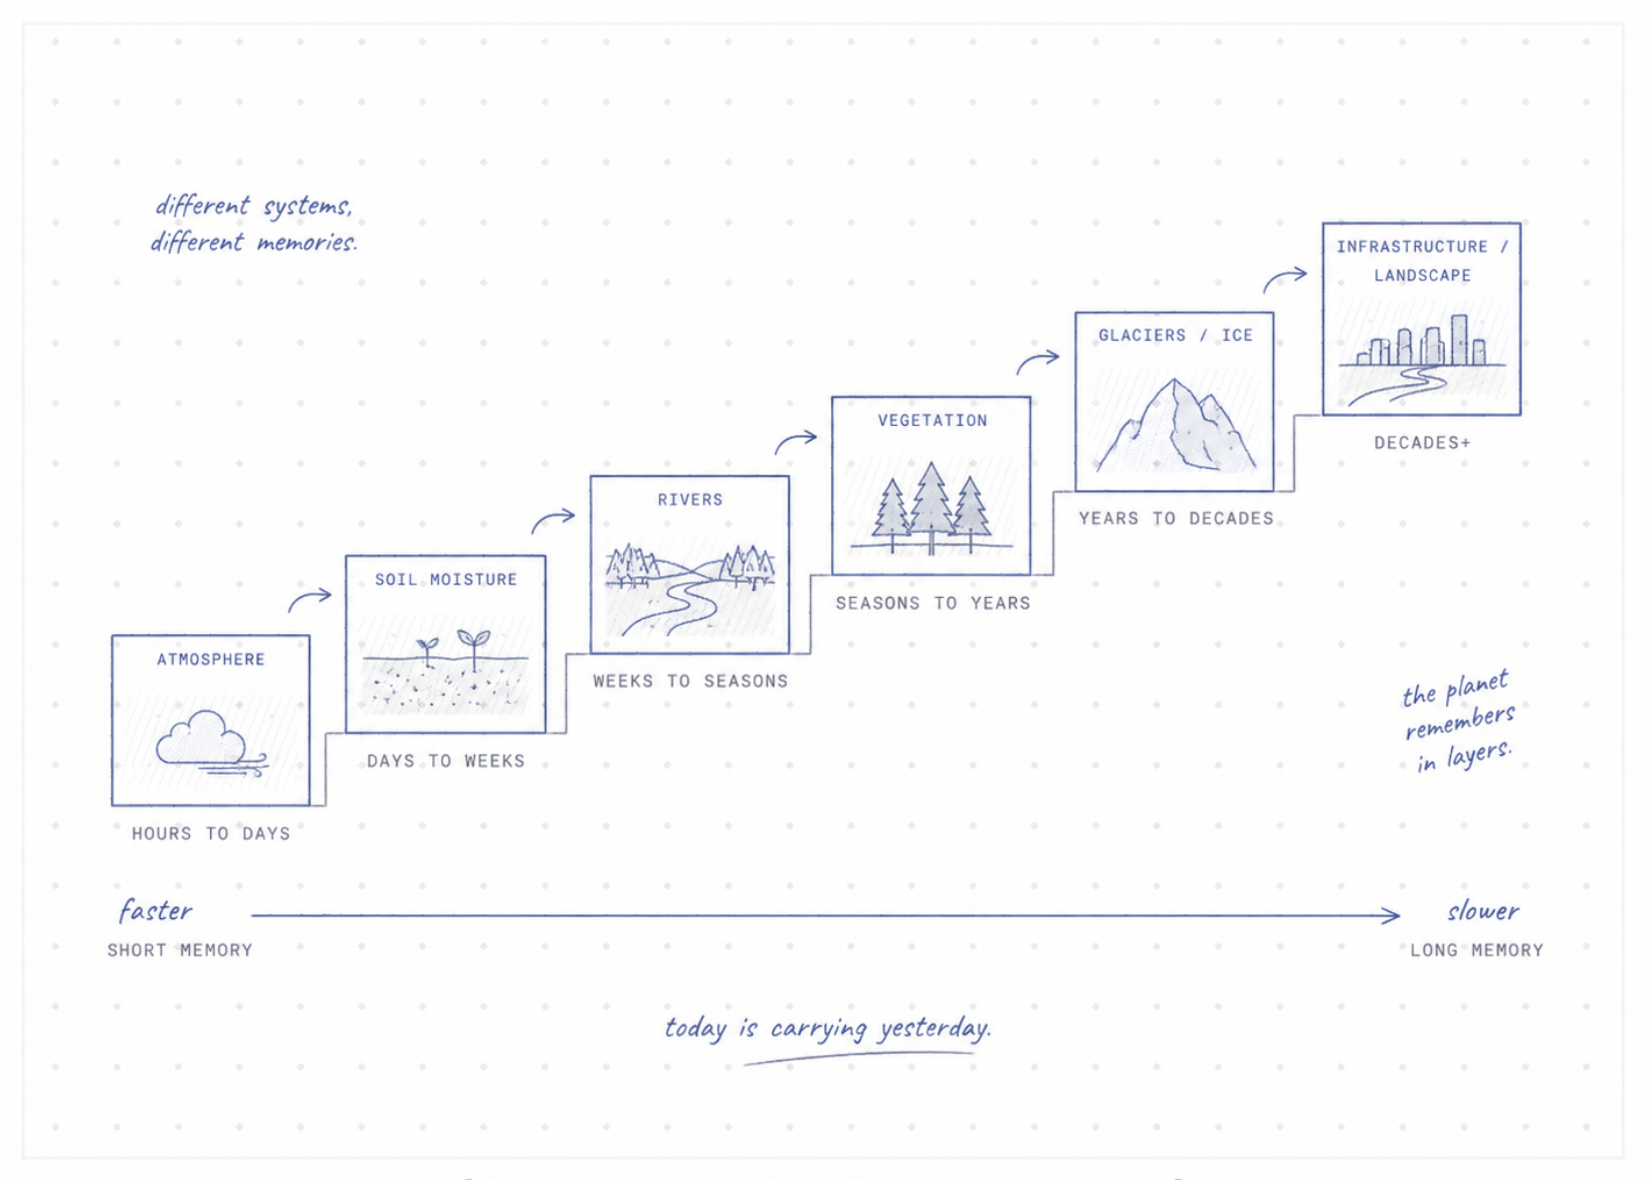
Rain can stop in an hour. The landscape does not reset in an hour. Soil stays wet, rivers stay high, reservoirs hold what arrived upstream, a slope stays unstable, and groundwater keeps moving long after the cloud that started it has gone.
A single picture of a place cannot show any of that. A snapshot records a state with no past. Measure the same grid square again and again, though, and it becomes something else: a line through time, with a slope, a seasonal shape and a history to compare today against. Most of Earth science now runs on these lines, and they changed the questions it was possible to ask.
REVISITS
The same square, visited again
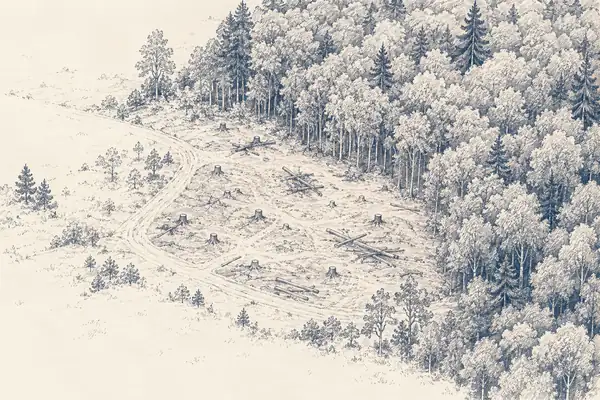
Landsat returns to each square every 16 days, Sentinel-2's pair every 5 and MODIS twice a day at coarser size. Each return adds one more number to every square's list, and after enough returns the dataset stops describing places and starts describing processes. The question shifts from what is growing here to when did it turn green this year compared with the last twenty, and from is this a forest to on what date did it stop being one.
That second kind of question depends on the square staying exactly where it was. Landsat has filed every scene since 1982 under the same Worldwide Reference System of paths and rows, so path 44, row 34 in 1985 and path 44, row 34 in 2025 are the same patch of Earth. A sharper sensor that redrew the grid would produce prettier pictures and wipe out the history of every square at once. For long records, a stable grid beats a sharp one.
Change detection is built on that stability. Forest disturbance alerts from Landsat and Sentinel compare each square's latest reflectance with the pattern it has followed for years and flag anything that departs from it. Most systems wait for the departure to show up in several later images before they believe it, because a single odd value is as likely to be the shadow of a cloud as the work of a chainsaw.
VEGETATION
Green is a rhythm, not a colour
Plotted across a year, a vegetation index draws a curve with a start of season, a peak and a decline, and the shape is different for every crop, species and way of farming. That curve is how satellite data tells maize from soy without ever seeing a single plant: not by how a field looks on one day, but by the rhythm it keeps across a hundred.
Underneath greenness sits a fainter signal. While photosynthesis is under way, chlorophyll re-emits a tiny glow of red light, called solar-induced fluorescence. Greenness says a plant has leaves. Fluorescence says whether the leaves are working. Plotted as a curve, it can sag during a drought while the greenness curve next to it has not moved, which is the difference between a field that looks fine and a field that is fine.
Forests keep score across years as well as seasons. A tree can survive one dry summer and enter the next one weaker, having lost leaves, grown less or damaged the water pipes inside its wood. A second hot year then produces what looks like sudden die-off but was prepared the year before. The same temperature does not mean the same thing every year, because the forest arrives at it with a different history, which is exactly what a curve records and a snapshot throws away.
WATER AND SOIL
Water as a height, a dampness and a weight
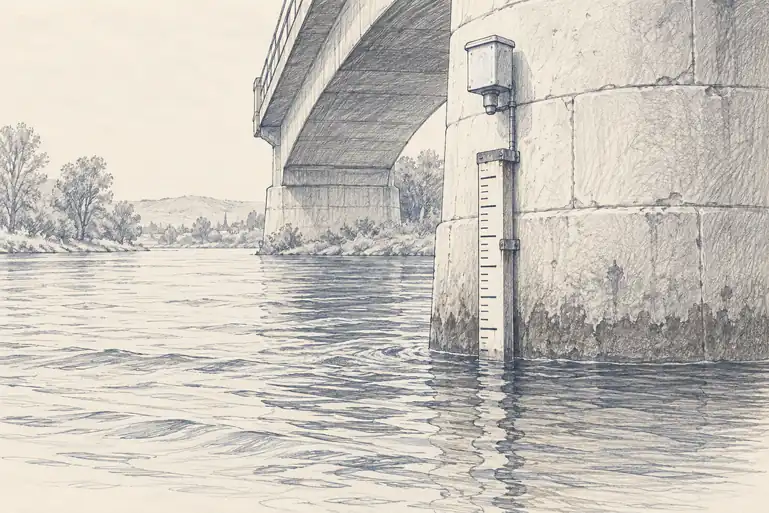
River gauges are among the oldest continuous environmental records still running, and what they measure is surprisingly narrow: the height of water at one spot. The number people actually want, how much water is flowing past, is calculated from that height using a relationship worked out for that particular channel. When a flood scours the riverbed, the relationship shifts. A century-long gauge record is therefore a long line with a definition inside it that moves every time the river rearranges itself.
Soil moisture is harder still, because it varies within a single field. NASA's SMAP satellite estimates it from faint microwaves given off by the top few centimetres of soil. Crops drink from much deeper, so the measurement is a stand-in for the thing that decides whether a plant is thirsty. Two farms under the same hot week make the point. One went into it after months of good rain, the other after a long dry spell. The weather is identical and the outcome is not, because the soil carries the earlier rain forward, changing how fast plants wilt and how much of the next storm runs off rather than soaking in.
Volume 2 described how GRACE weighs water by feeling the planet's pull on two satellites. For data, the telling detail is that a single GRACE measurement means nothing. One reading of gravity is just a number. Only the difference between this month and last month, repeated for years, becomes a curve of water being lost, which is how the draining of aquifers beneath farmland became visible: the same squares, weighed the same way, again and again.
Some things still cannot be measured from above at all. Nitrogen, acidity and organic carbon belong to material below the surface, and the only way to know them is to dig, bag and send the sample to a laboratory, which is accurate and does not scale to a continent. iSDAsoil, built by the nonprofit iSDA, trained a model on more than 100,000 laboratory-tested samples matched against Sentinel-2 and Landsat imagery, terrain and climate, and mapped more than 20 soil properties across all of Africa at 30 metres, where earlier maps had managed about 250. It is an estimate of what a soil test would find, anchored to real tests. The measurements stop at the sample holes. Everything between them is calculated.
MEMORY
A place carries its past
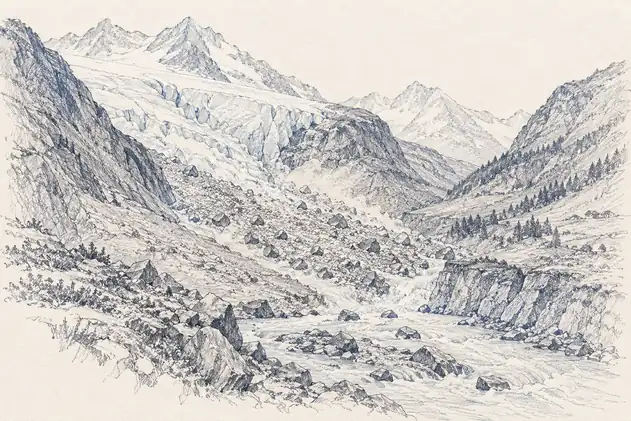
Ice keeps the longest memory of all. A glacier does not respond to one warm afternoon. Its shape is years of snowfall, melt, flow and fracture, and heat can weaken it slowly before the visible change arrives all at once. On 4 August 2026, a 76 square kilometre section of the floating tongue of Petermann Glacier in northwest Greenland broke away. Sentinel-1 radar images had shown fractures and deformation developing for months beforehand. The break made the news. The history of the break had been sitting in the image record all along.
Three weeks later a similar history ended in disaster in Nepal. On 26 August 2026 a catastrophic debris flow began high in Langtang National Park. The U.S. Geological Survey reported that the first movement was still uncertain, either a landslide that picked up glacier ice or a collapse of the glacier itself, before ice, water and rock tore downslope into the river system. By the time it reached people it was called a flood, yet rain was not how it began. Reading it in advance would have meant connecting glacier and slope movement, earthquakes, river levels and the roads and villages downstream.
People leave memory in the landscape too. A road changes where water drains. A reservoir traps sediment. A new neighbourhood replaces soil with concrete. A sea wall pushes wave energy along the coast to someone else. Years later a flood or heatwave arrives looking like a natural event, and the damage traces the outline of old planning decisions.
The same place under the same weather can behave differently because it arrived there through a different past.
That is the case for keeping long records, and it complicates everything that comes after them. A description of a place is easiest to build from a few numbers about right now: temperature, rainfall, greenness, river level. A useful one may also need last season's rain, last decade's droughts and fires, glacier movement and when the dam gates were opened. A single image shows a state. A curve shows the path that led to it, and when a machine one day tries to understand a landscape, the path may matter more than a sharper eye.