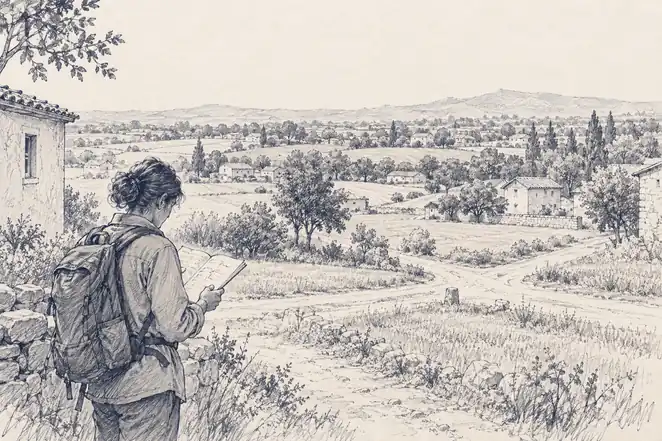
DRISHTI · CHAPTER 3.2
Where Exactly Is Anything?
The first digital image was a baby in 176 squares. Soon the whole planet was squares too, and deciding where each one sat needed a conference, a fictional Earth and a satellite clock.
EARTHVISION LAB · ~6 MIN READ
THE FIRST PIXEL
In 1957 Russell Kirsch, a computer scientist at the U.S. National Bureau of Standards, fed a photograph of his three-month-old son Walden into a drum scanner attached to SEAC, one of the first programmable computers in the United States.
The machine divided the picture into 176 rows of 176 squares and stored each square as a number. The result, 30,976 numbers that together looked like a baby, was the first digital image. A very small, very serious-looking person is the ancestor of every satellite picture ever taken.
Fifteen years after Walden, Landsat 1 was doing the same thing to the entire land surface of the planet. The grid became the basic unit of place, and it brought two questions with it that took decades to settle: what a single square is allowed to contain, and where on Earth, exactly, each square sits.
THE CELL
A grid decides what is too small to matter
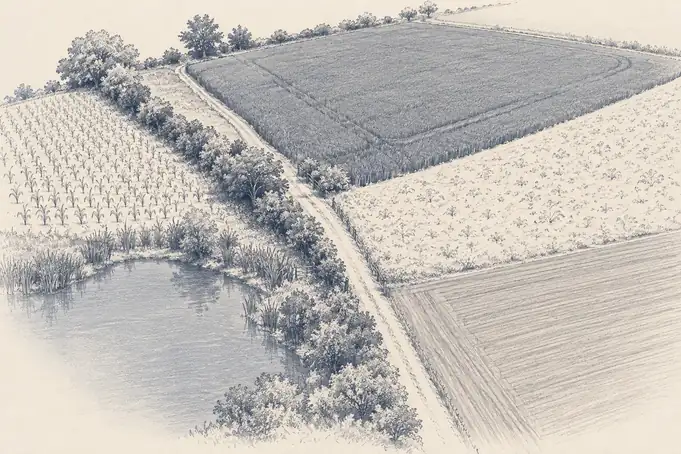
A Landsat 1 pixel covered roughly 80 metres on a side. Modern Landsat pixels cover 30, about 900 square metres, or a fifth of a football pitch. Whatever sits inside one, a hedgerow, a farm track, a pond and three different crops, is recorded as a single value in each band of light. The value is an honest measurement of all of them at once. The hedgerow, as a thing in its own right, has left the building.
Volume 2 followed what each band of light reveals. What matters for data is that the bands are stacked in the same square, so every pixel is a short column of numbers describing one patch of ground in several wavelengths. A computer can separate water from forest from bare soil by doing arithmetic on those columns, without anyone looking at the picture, and nearly every land map made from satellites is built that way.
Choosing a pixel size is choosing what the data is able to notice. At 30 metres a field is visible and a tree is not. At 10 metres a tree appears and a garden does not. At a kilometre a city becomes a smudge. None of these is correct in general. Each is an agreement about which things are big enough to count, and everything smaller joins the average.
LINES AND SHAPES
Rivers, roads and fences do not come in squares
A grid assumes space is best cut into equal squares. That suits things that change smoothly across a surface, such as temperature, rainfall, reflectance or height. It suits badly anything defined by an edge or a connection. A river is a line. A road network is a set of links. A property boundary is a shape with lawyers attached. An animal's territory is none of these and all of them on different days.
So a second way of recording place grew up beside the pixel. Vector data stores points, lines and shapes by their coordinates: a field becomes a polygon with an exact edge, a river a line that knows which way it flows, a well a single dot. Vectors can say precisely where something ends, which a grid of averages never can. The price is that someone has to decide in advance what the things are and draw them.
Most useful maps of the planet use both. A crop yield estimate is pixels added up inside a field's outline. A national deforestation figure is pixels counted inside a border. Both only work if the pixels and the outlines agree about where they are, which turns out to be a much harder question than it sounds.
DATUMS AND MERIDIANS
Even zero had to be agreed
A soil sample and a satellite pixel have nothing in common as measurements. One is wet chemistry in a laboratory, the other is light recorded from orbit. What lets anyone use them together is a pair of numbers that means the same thing to both. Position is how unrelated records meet, and nearly every combined dataset in the book, soil maps trained on imagery, flood forecasts fed by river gauges, species records matched to habitat, depends on it.
Even zero had to be negotiated. For most of the nineteenth century nations measured longitude from their own capitals, so French and British charts disagreed about where the world began. In October 1884 delegates from 26 nations met in Washington for the International Meridian Conference and voted to count longitude from Greenwich, chiefly because more than two-thirds of the world's shipping already used British charts. San Domingo voted against. France and Brazil abstained, and French maps went on measuring from Paris for decades afterwards, on principle.
Agreeing on zero was the easy part. A coordinate also needs a model of the shape of the Earth to measure against, and the planet is neither a sphere nor quite an ellipsoid. National surveys each fitted their own reference shape, called a datum, to their own territory, because a local fit was more accurate than a global compromise. The same doorstep could therefore have coordinates hundreds of metres apart depending on whose map you trusted. WGS 84, the reference frame used by GPS, settled the matter for most purposes by declaring one mathematical Earth that everyone's numbers would refer to. It is a less famous achievement than any satellite and rather more useful.
Then comes flattening. A curved surface cannot be laid flat without stretching area, shape, distance or direction, so every map projection chooses which of those to sacrifice. Greenland on a classroom wall map looks about the size of Africa, which it is not, by a factor of roughly fourteen. Two land-cover statistics computed in different projections can disagree for no reason except the flattening, which is why careful work always says which projection it used.
GPS, CLOCKS AND UNCERTAINTY
Position became free, and so did the time
Volume 2 traced satellite navigation back to two physicists listening to Sputnik's beep. What that idea eventually did to data was make position free. GPS reached full operation in 1995. A receiver measures how long signals from several satellites took to arrive and works out the one place consistent with all of them, and because the calculation depends on timing, every receiver also carries a very precise shared clock. Europe's Galileo, Russia's GLONASS and China's BeiDou followed, and modern receivers listen to several at once. A tractor, a phone, a shipping container, a collared wolf and a field biologist all now know where they are without anyone regarding it as a measurement.
The clock matters as much as the position. A timestamp is the second coordinate of every observation, and when unrelated systems record time the same way, sequences can be reconstructed: whether a flood warning came before or after a dam release, whether a fire was detected before or after a lightning strike, whether an animal moved before or after a road opened. The Vienna congress wanted everyone reading their barometers at the same moment. Satellite navigation gave everything the same moment for free.
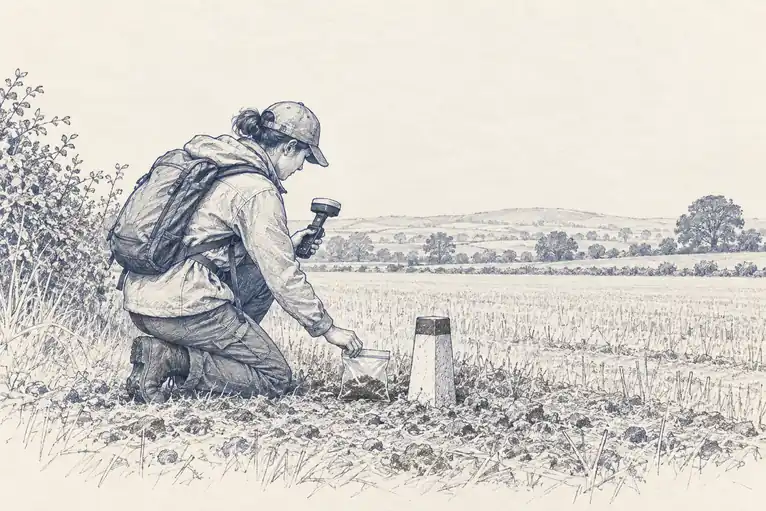
Free precision brought a new temptation. A coordinate printed to six decimal places implies accuracy of about a tenth of a metre, while the observation behind it may be far vaguer: a species recorded at the centre of a district, a soil sample placed at the nearest track junction, an old record pinned to a village that has since moved. The number has no room to say roughly. A record that honestly means somewhere in this valley ends up being used as though it meant this exact rock.
The fix is refreshingly plain: say how uncertain the position is. Darwin Core, the biodiversity standard from the rescued specimen drawers, includes a field for exactly that, coordinate uncertainty in metres, so a record can read this rock, give or take five metres, or this valley, give or take ten kilometres. A coordinate with an honest radius is worth more than one with six confident decimal places, because it tells the next person how far to trust it.